
Traders and market analysts use various indicators and ratios to determine the value of the stocks, assets, commodities, and currencies with which they engage. When it comes to Bitcoin, however, things are a bit different.
Because of its nature and the fact that it’s the world’s first fully functional digital currency, there are differences which must be accounted for.
For example, when individuals trade stocks, they take advantage of the so-called P/E Ratio, or Price-to-Earnings Ratio. It measures a stock’s current share price relative to its per-share earnings.
With Bitcoin, however, this is hardly applicable because it’s not a stock. There is something similar, though, and it’s called the NVT Ratio.
What is the Bitcoin NVT Ratio?
Bitcoin’s NVT Ratio, also known as Bitcoin’s Network Value to Transaction Ratio, indicates whether Bitcoin is overvalued or undervalued.
The ratio represents the cryptocurrency’s network value (which is its current market capitalization) and the transaction volume that’s transmitted through Bitcoin’s blockchain over a period of 24 hours. That’s perhaps why some people actually refer to the NVT Ratio as Bitcoin’s P/E Ratio. It’s because it uses the value which flows through the network as a proxy for company earnings.
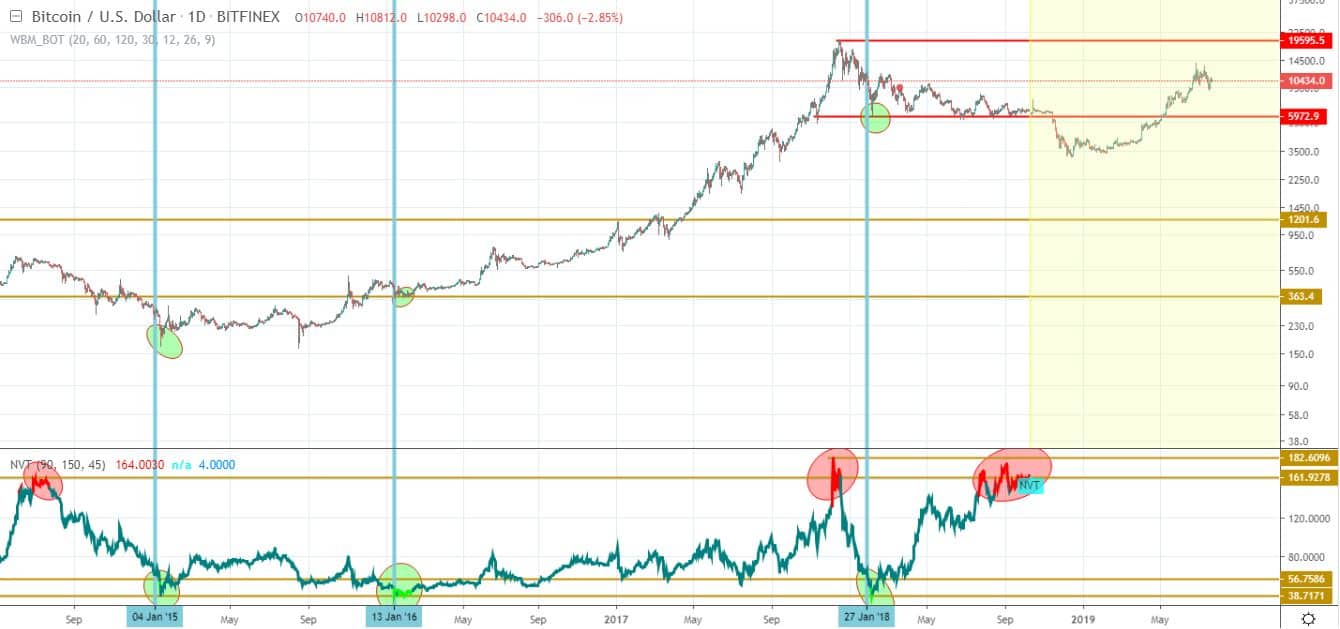
The chart shows both Bitcoin’s current price (top line) as well as Bitcoin’s NVT Ratio (lower line).
How to Calculate the Bitcoin NVT Ratio
It’s actually fairly easy to calculate Bitcoin’s NVT Ratio. You just have to divide its current market capitalization by the USD volume transacted over its blockchain over the past 24 hours.
The data is easily accessible. You can find the market cap on websites such as CoinGecko, and the transaction volume on websites such as blockchain.com.
Keep in mind that using data from different tracking websites will probably give you different NVT ratios because the data displayed there could vary.
The person who conceptualized Bitcoin’s NVT Ratio is popular independent crypto researcher and analyst Willy Woo.
However, it’s also worth noting that Bitcoin’s market cap can vary significantly due to its extreme volatility. The volume transacted on the network can also vary, and that’s why there’s another ratio called the Bitcoin NVT Signal or Bitcoin NVTS.
What is the Bitcoin NVTS?
Bitcoin’s NVTS is almost the same as the NVT ratio, but it’s actually more accurate and responsive. In order to determine the ratio, all you need to do is divide Bitcoin’s market cap by its 90-day transaction volume.
The NVTS Ratio was conceptualized by the chief research officer at Cryptolab Capital, Dmitry Kalichkin.
Kalichkin, however, acknowledges the limitations of these indicators because they don’t factor in the number of transactions or the number of active daily addresses.
How to Use the Bitcoin NVT Ratio
Just like any indicator, the NVT Ratio can provide valuable information which could impact your decision-making process.
As we explained earlier, its main purpose is determining whether Bitcoin is undervalued or overvalued. The indicator could potentially tell you whether it’s time to sell as the asset is severely overpriced and a correction is coming, or to buy because its value is not yet represented in its price.
There are various theories as to when the NVT is indicative of the state of the market and how best to use it, but ultimately the decision is yours.
Some analysts suggest that Bitcoin is in bubble territory when the NVT Ratio is 95 or above. In order for the ratio to be high, Bitcoin’s market cap must substantially outweigh its transaction volume, potentially signaling that the price is unjustifiably inflated. Naturally, the opposite can also be true.